🧭 A/B Test Screens
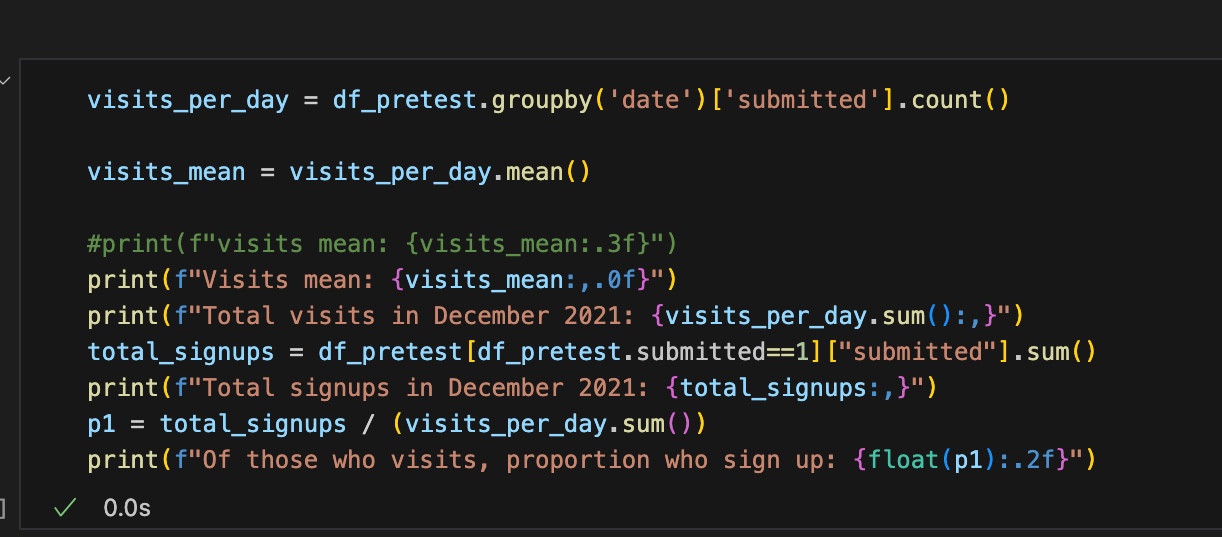
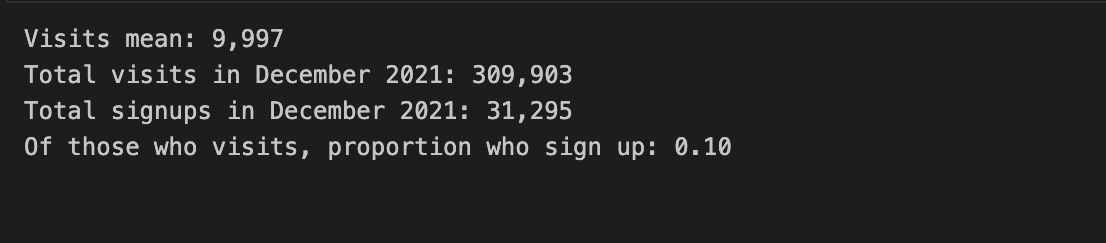
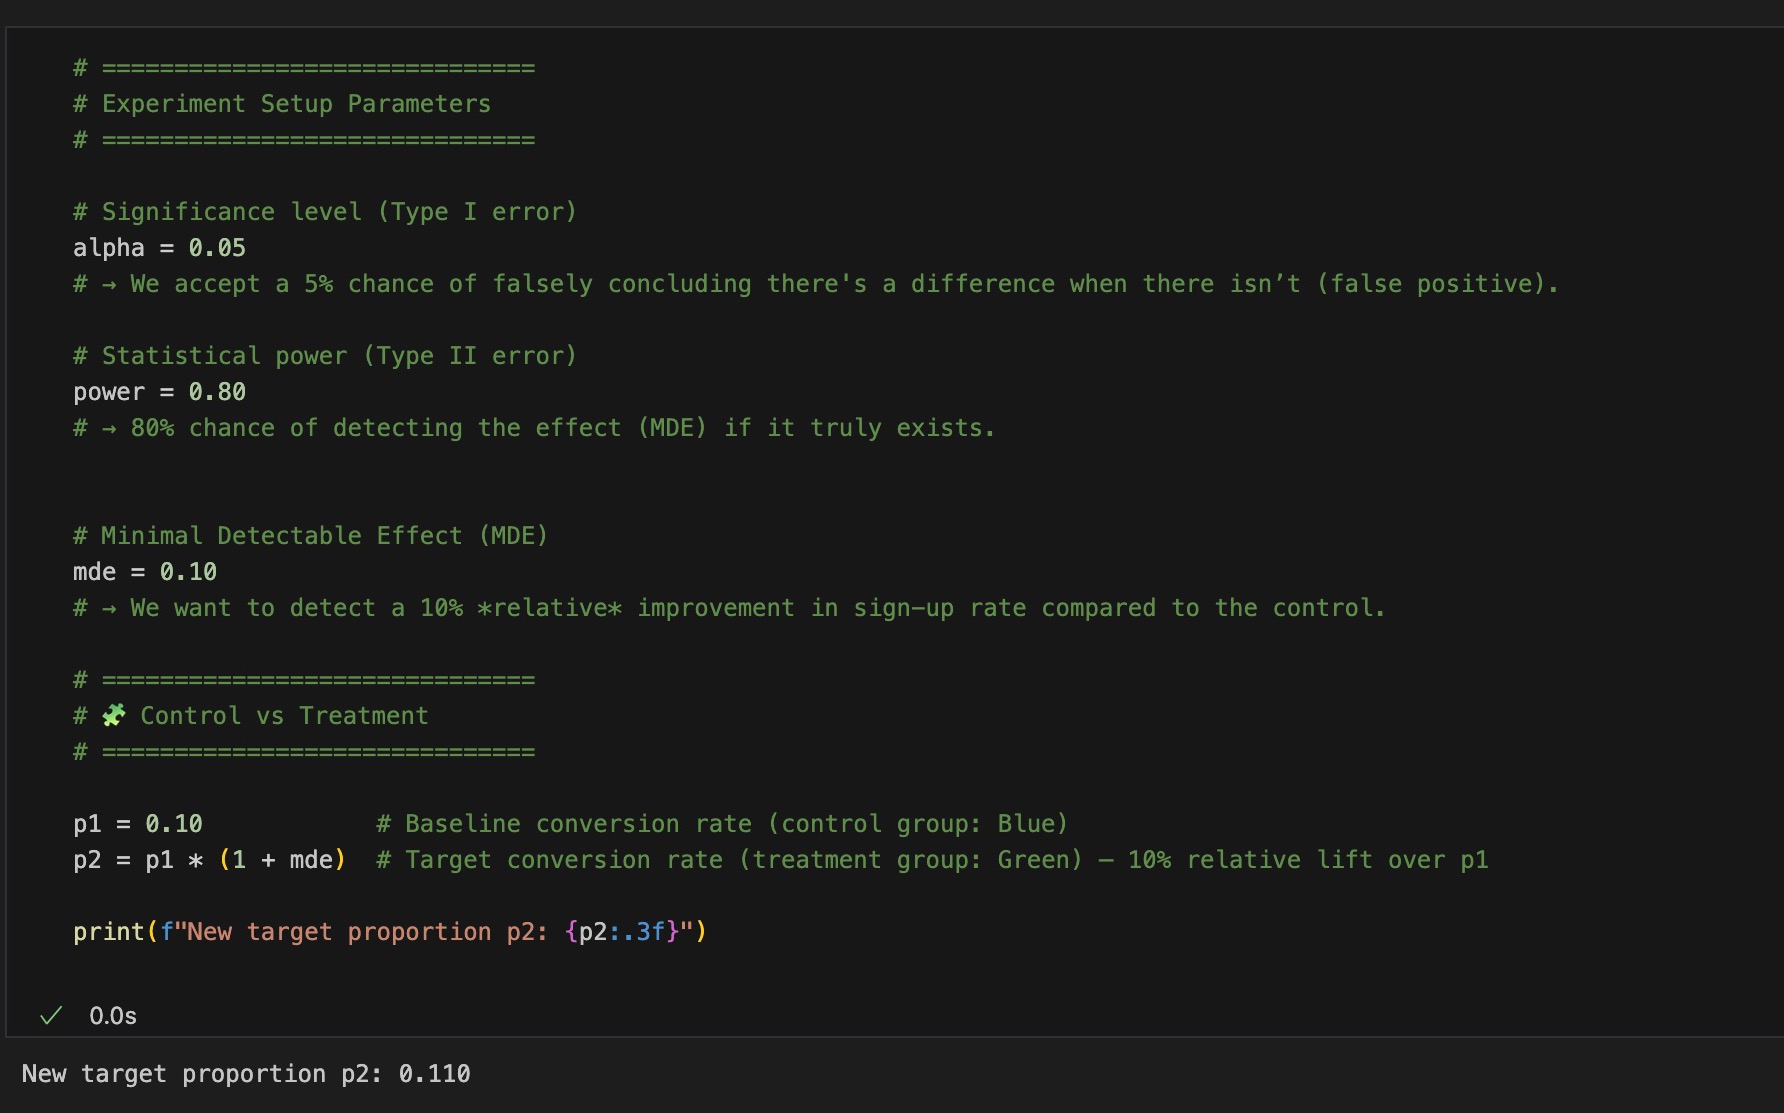
Experiment Setup Parameters
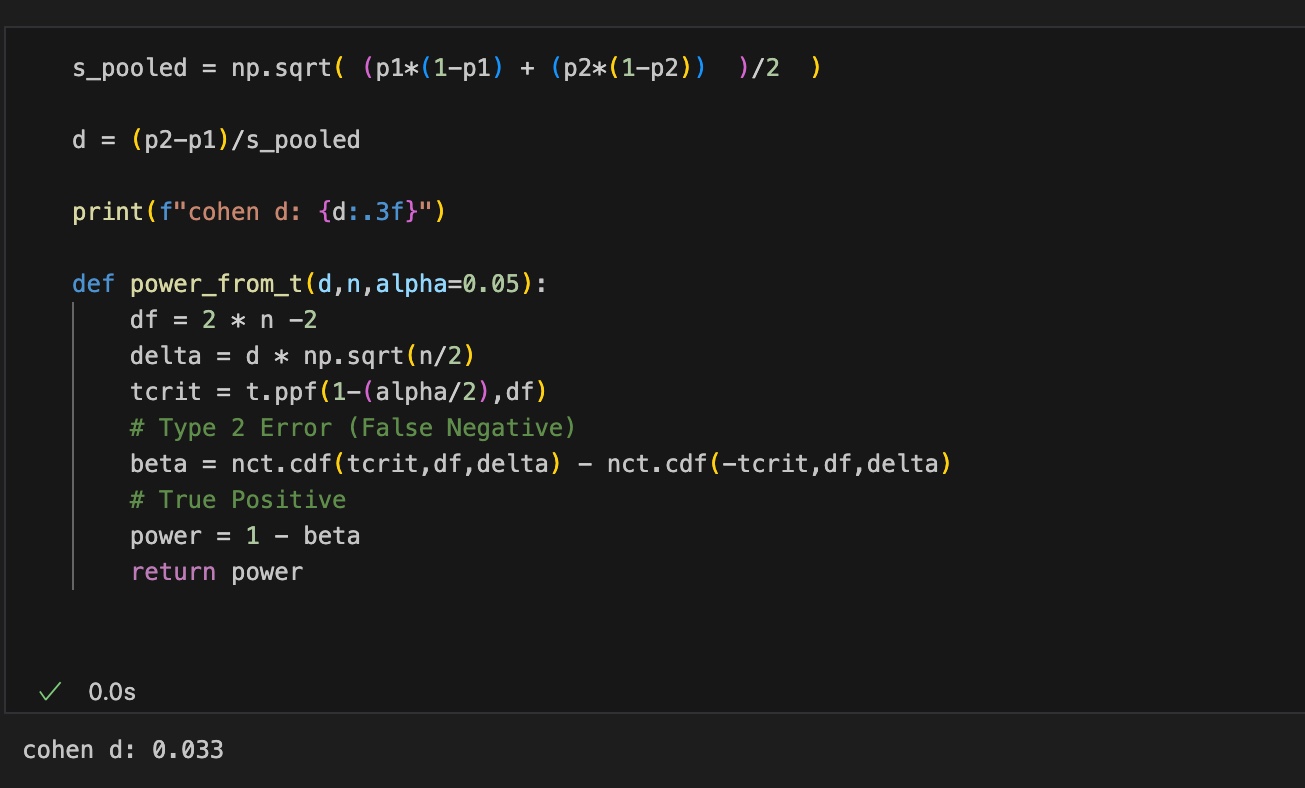
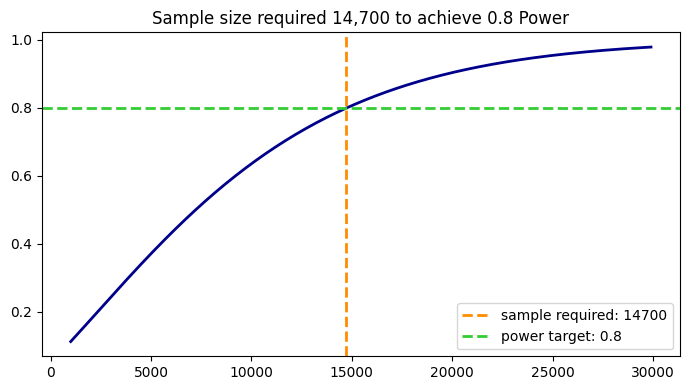
Since the effect size is very small (Cohen’s d = 0.033), the experiment requires a large sample size to achieve a statistical power of 0.8. Based on the power curve above, approximately 15,000 samples per group (around 30,000 total) are required.
An MDE of 0.10 means increasing conversion from p₁ = 0.10 to p₂ = 0.11. Detecting such a small increase requires many observations because the baseline rate is small relative to visits.
Smaller baseline → smaller effect size → larger sample requirement.
📈 Days Required to get required total sample size of 30,000
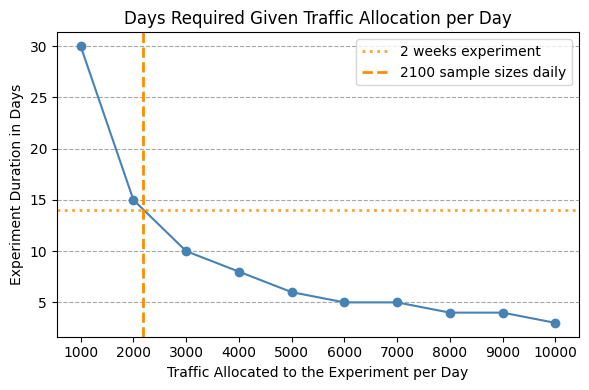
A 14-day experiment is the best choice — long enough to avoid noisy results yet short enough to deliver insights quickly. It also satisfies all statistical and practical requirements: achieving the required total sample size (~29,400 ≈ 30,000), requiring only ~2,100 users per day which matches real traffic levels, and meeting the 0.8 statistical power needed to detect the expected effect. Together, these factors make a 14-day experiment the most reliable and efficient design.
A/B Test Data Period and Sample Size
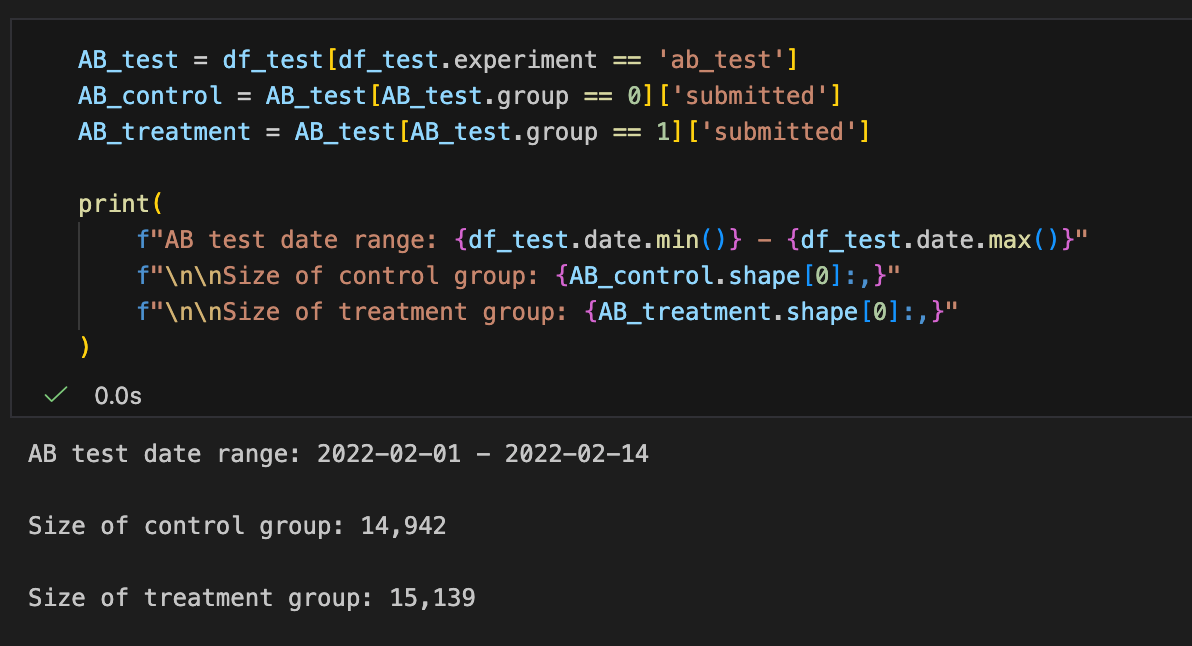
The A/B test meets all statistical and practical requirements for a two-week experiment. Both the control group (14,942 visitors) and the treatment group (15,139 visitors) fall neatly within the targeted ~15,000 users per group, which was determined to be sufficient for achieving 80% statistical power given the expected effect size. The experiment spans 2022-02-01 → 2022-02-14, providing a full 14-day observation window.
With balanced group sizes, adequate traffic, and the full required duration, you are fully cleared to proceed with analyzing the A/B test results.
A/B Test Parametric p-value
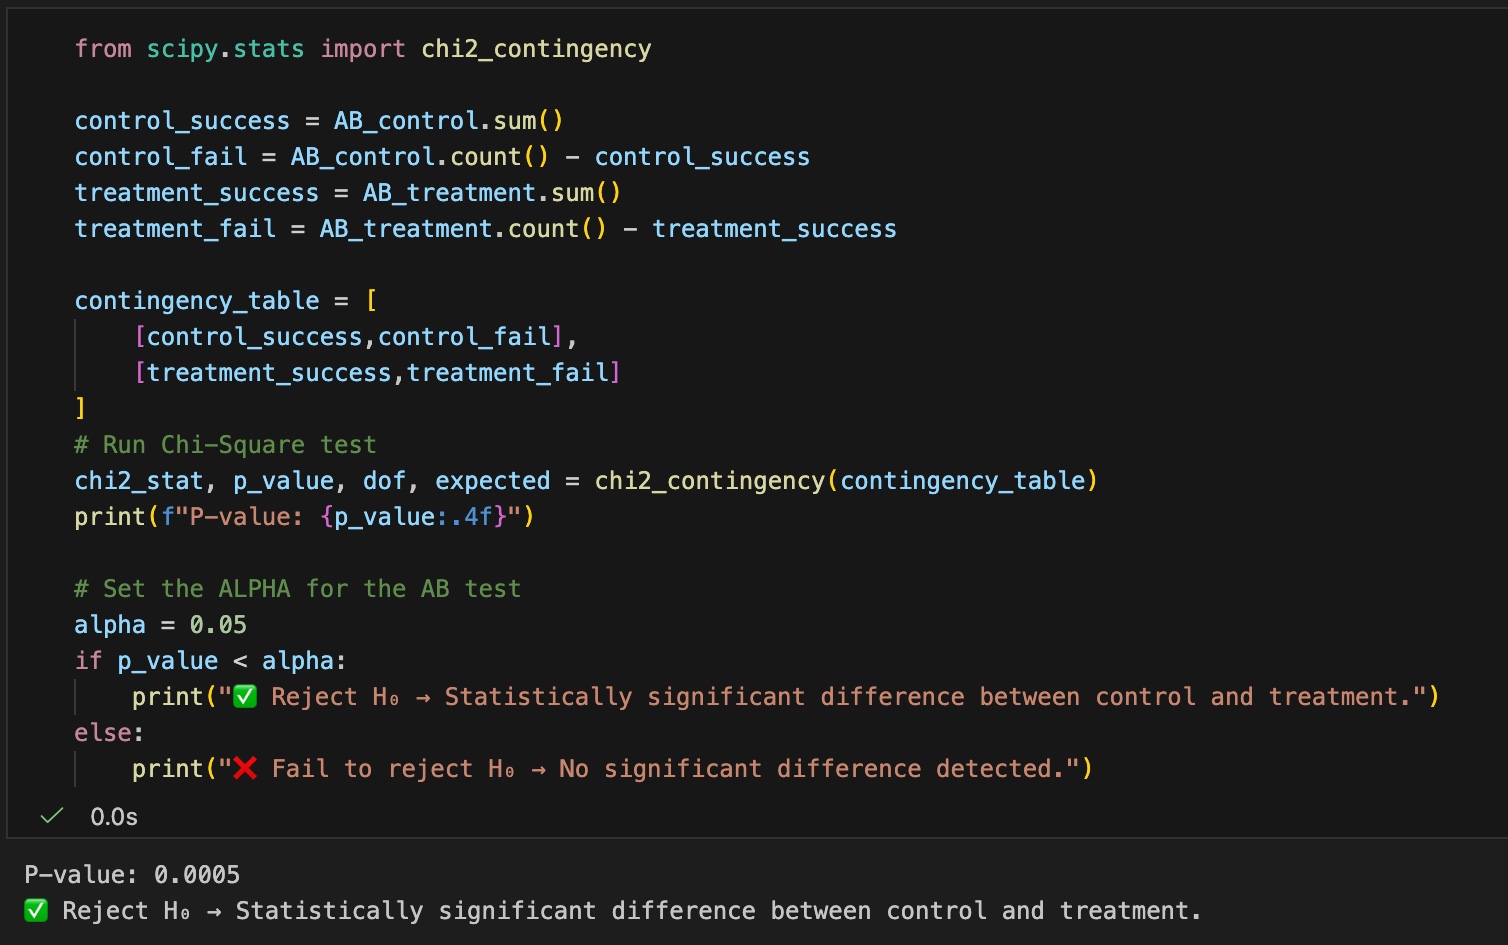
The p-value (0.0005) is smaller than what we would expect from random variation under the assumption that the null hypothesis is true. Because the result is statistically significant, we reject the null hypothesis and conclude that the new treatment produces a meaningful lift in sign-up rate, increasing it to p₂ = 0.11.
As you can see on the left, the proportion of users who sign up (p₁) is 0.10 . We aim to increase this proportion by 10%, which defines our Minimal Detectable Effect (MDE).
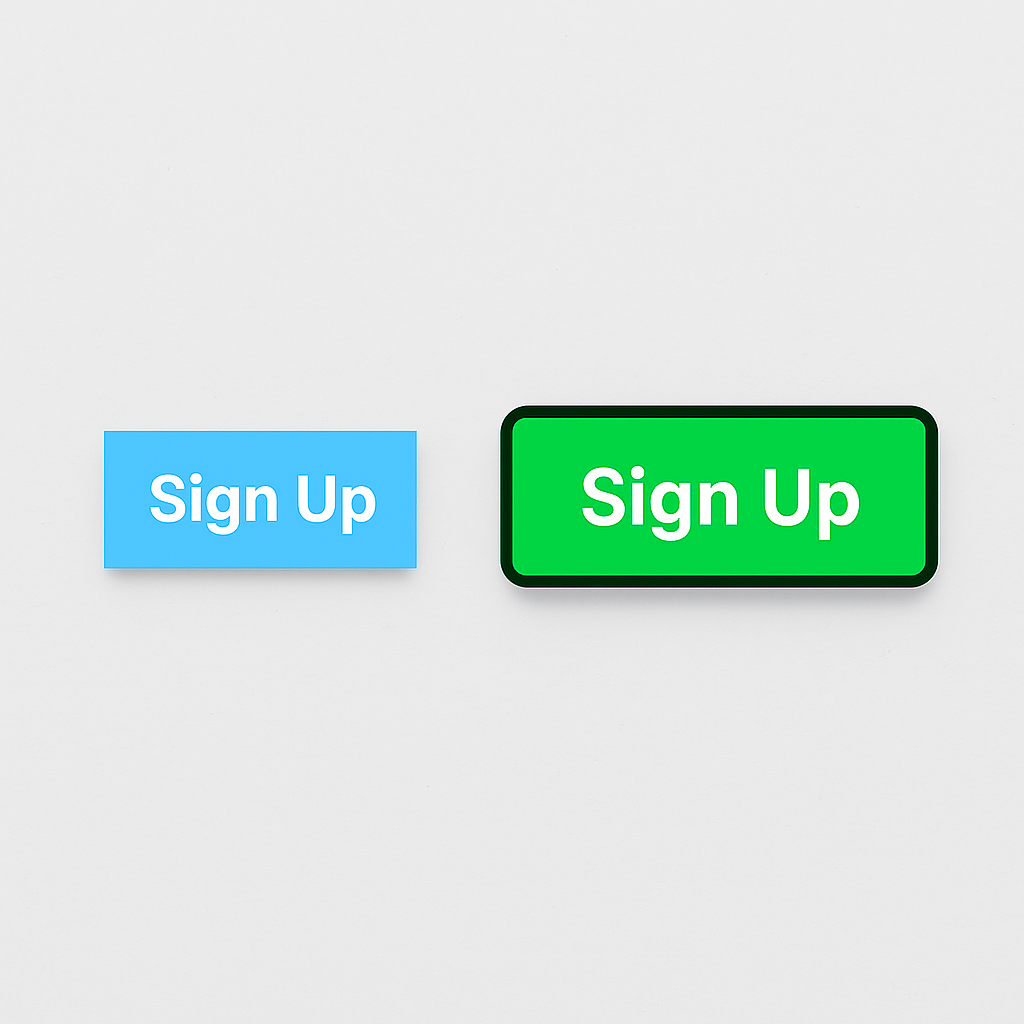
To achieve this, the control’s smaller blue button was replaced with a modern green design for the treatment group. We want to determine whether this new design truly increase sign-ups by the targeted MDE.