AB Testing
This A/B test explores whether a redesigned sign-up button improves conversions. I validated the setup with an AA test, determined the required sample size, executed a two-week experiment, and computed the final p-value using chi-square proportion testing. Results show a clear, statistically significant improvement from the new design.
🧪 A/B Testing Case Study: Measuring the Impact of a New Sign-Up Button Design
This project demonstrates a full end-to-end A/B testing workflow using real user-behavior logs. It covers hypothesis design, power analysis, AA validation, sample-size determination, and statistical testing.
The goal is to determine whether a new green sign-up button improves conversion compared to the existing blue button.
Step 1 — Understanding the Data
We begin with 31 days of traffic data from December 2021. Daily visits average around 10,000 per day, totaling roughly 310,000 visits.
The experiment includes two variants:
-
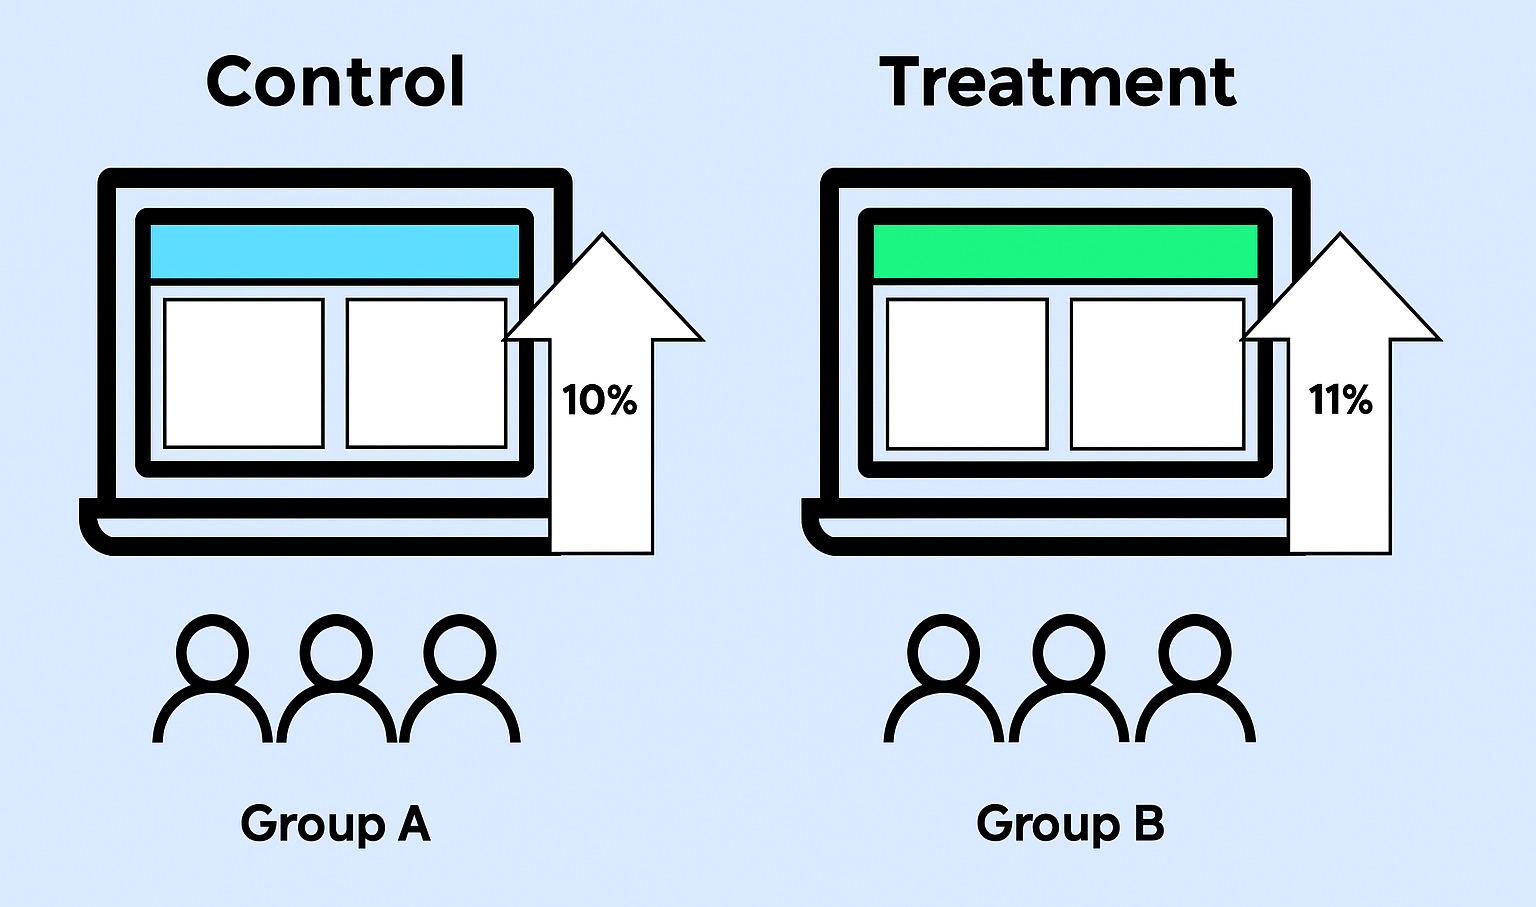
🟦 Control: Original blue sign-up button
-
🟩 Treatment: New green sign-up button
Key considerations when designing the test:
-
Group allocation and daily unique visitors
-
Baseline conversion rates
-
Required sample size to detect meaningful differences
Step 2 — State the Hypotheses
Null Hypothesis (H₀)
The sign-up rates of the blue and green buttons are the same.
Alternative Hypothesis (H₁)
The sign-up rates of the blue and green buttons are different.
Experiment parameters
-
Significance level (α): 0.05
-
Target power: 0.80
-
Minimum Detectable Effect (MDE): 1% absolute lift
-
Test type: Two-sample, two-tailed
Step 3 — Power Analysis & Sample Size Determination
We assume the sign-up rate increases from 10% → 11%. The effect size is computed using the pooled standard deviation:
-
p₁ = 0.10 (control rate)
-
p₂ = 0.11 (treatment rate)
Pooled standard deviation:
$$ s_{\text{pooled}} = \sqrt{\frac{p_1(1 - p_1) + p_2(1 - p_2)}{2}} $$
Effect size (Cohen's d):
$$ d = \frac{p_2 - p_1}{s_{\text{pooled}}} $$
Using the effect size d and the noncentral t distribution, we compute power across different sample sizes and find the smallest n that achieves about 80% power.
Result
-
Required sample per group ≈ 15,000
-
Total required sample ≈ 30,000 visitors
Step 4 — Experiment Duration
Daily unique visitors ≈ 10,000. If we allocate around 20–30% of traffic to the experiment, we get:
-
≈ 2,100+ visitors per day entering the experiment
-
≈ 15,000 visitors per group over 14 days
Chosen experiment duration: 14 days.
This duration balances:
-
Statistical reliability
-
Coverage of weekly traffic patterns
-
Reasonable time to deliver insights to the product team
Step 5 — AA Test Validation (Randomization Check)
Before analyzing the A/B test, an AA test is performed to validate:
-
Randomization
-
Identity consistency
-
Correct instrumentation
AA Test Key Findings
-
✔ Perfect group labels detected (0 and 1)
-
✔ Balanced split: 14,982 (Group 0) vs 15,057 (Group 1)
-
⚠ ~0.66% duplicate emails — normal for high-traffic logs
-
⚠ ~0.66% emails mapping to multiple visitor IDs — worth monitoring
-
✔ No invalid rows
-
✔ Chi-square p ≈ 0.459 → Fail to reject H₀ → AA test PASSED
The AA test confirms that sampling and randomization are healthy.
It is safe to proceed with the A/B test.
Step 6 — A/B Test Statistical Results
Experiment period: 2022-02-01 → 2022-02-14
Group sizes
-
Control: 14,942 visitors
-
Treatment: 15,139 visitors
Conversion outcomes
-
Control: 1,428 success, 13,514 fail → 10% conversion
-
Treatment: 1,632 success, 13,507 fail → 11% conversion
A Chi-Square test on the 2×2 contingency table yields:
-
P-value = 0.0005
Since p < 0.05, we reject H₀ and conclude that the treatment provides a statistically significant improvement.
Interpretation
-
The green button delivers a real lift of about 1% absolute.
-
The lift is statistically significant and operationally meaningful.
-
The treatment is a strong candidate for rollout.
Final Conclusion
The green sign-up button should be adopted.
This decision is supported by:
-
Clear hypotheses and experimental design
-
Correct sample-size planning via power analysis
-
14-day duration ensuring traffic stability
-
AA test confirming data integrity
-
Statistically significant result (p = 0.0005)
This full pipeline reflects standard experimentation strategy used by modern data-driven companies.